
One of the best ways to remain adaptable and resilient as a business owner is to prepare for what might be around the corner.
Playing out “what if” scenarios is a powerful way to visualize the impact of changes that can impact your business. And with as little as an Excel spreadsheet, you can make informed decisions when it comes to pricing, marketing campaigns, and strategic tweaks to create results for your online store.
In this guide, you’ll learn about what-if analysis functionality in Excel, why it’s beneficial for your business, and the exact steps for running it.
Table of contents:
- What is a what-if analysis?
- Benefits of using what-if analyses in ecommerce
- How to conduct a what-if analysis for your ecommerce store
- Make the right decisions with what-if analyses
- What-if analysis FAQ
What is a what-if analysis?
A what-if analysis, also known as a sensitivity analysis, is a method for forecasting and understanding the impact of different scenarios on your business. There are three ways to do it in Excel: Scenario Manager, Goal Seek, and Data Table.
You can run powerful what-if analyses in a simple Excel spreadsheet and plot out different assumptions and scenarios to ultimately make better decisions for your ecommerce business.
These can be scenarios like:
- When should I discount my inventory to maximize revenue during a season?
- What should be my conversion rate to meet a revenue goal?
- How many products do I need to sell per month to stay profitable?
Essentially, a what-if analysis helps you answer this question: What would happen with [an outcome] if our store [executed a strategy/hit a KPI]?
Benefits of using a what-if analysis in ecommerce
Even though Excel can seem complicated, its what-if analysis features are easy to set up, and the results you get are easy to digest and understand.
Here are the main benefits of learning the answers to a number of “what if” questions:
1. Informed decision making
Plotting out possible scenarios ahead of time mitigates needing to make blind decisions around the best way to grow your revenue, launch a new product, or expand into a new market. Instead, you can brainstorm a variety of different scenarios and change out variables to find the best possible combination for the goal you want to achieve.
Knowing these scenarios—like how your software costs affect your profit, or how changing your prices influences revenue—can determine the tools you choose to run your store, the vendors you partner with, your product assortment, and other building blocks of your online store.
For example, a workout wear brand could use what-if analysis to plan its Black Friday promotions in a way that will bring the most profit to the company based on the inventory it will be able to offer during that time.
2. Efficient consensus building
提出新的想法在运营团队improvements, pivots, or other approaches to growth almost always sparks a “But what if…?” from those in the room. Implementing a what-if analysis ahead of time helps to easily answer this question in an objective way.
For example, a teeth whitening brand might use a what-if analysis to give clear insights and forecasts to its influencers. For example, it could share how influencers’ reach and engagement drive direct sales, and how increasing that by a certain percentage could affect the company’s—and influencers’—revenue.
3. Staying one step ahead
In ecommerce, consumer trends, supply chain timelines, and other logistics shift quickly. A what-if analysis removes the need to manually update different variables and helps you find business forecasting answers quickly, which in turn keeps you flexible, agile, and able to plan ahead efficiently.
A cosmetics brand, for example, could use a what-if analysis to forecast its sales and profit margins in a new country based on data from the markets it’s currently present in. Excel’s what-if analysis features also make it easy to tweak the forecast in just seconds once new data comes in—instead of building the entire forecast from scratch.
How to conduct a what-if analysis for your ecommerce store
In Excel, there are three ways to run a what-if analysis, allowing you to choose the one that matches your scenarios and use cases:
- 年代cenario Manager: create unlimited scenarios with up to 32 variables
- Goal Seek: uncover the variables you should achieve in order to hit your goal
- Data Table: analyze unlimited possible values based on one or two variables
Dive into each section to learn how you can apply these in your ecommerce business, and how to set them up in Excel.
年代cenario Manager
With Scenario Manager, you can model future outcomes based on multiple variables and their input values.
For example, imagine you’re considering running a sale on one of your product categories and you want to learn how different discount percentages will affect your revenue. That’s what you can do with this feature—it plots out the figures so you can easily compare them side by side.
With the above scenario as the example, here are the steps to build a what-if analysis using the Scenario Manager feature:
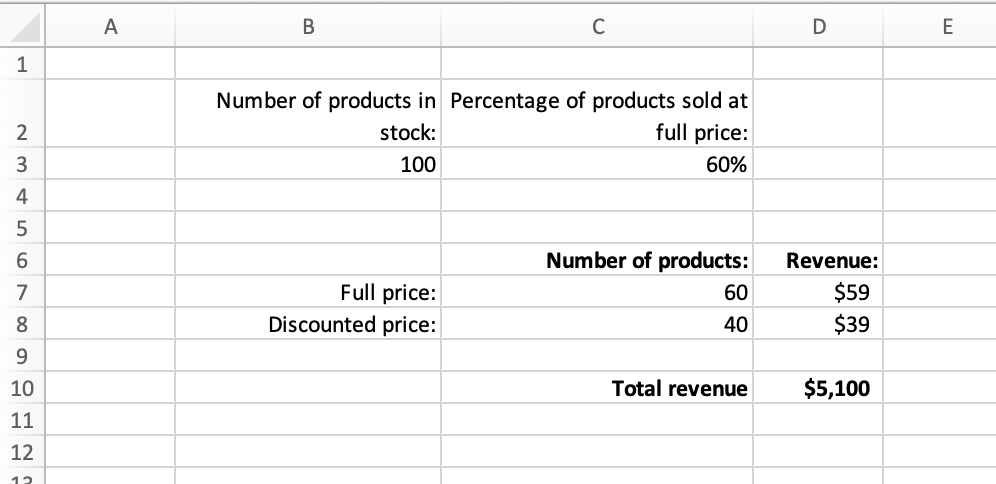
First, create a table that defines your key figures:
- The number of products in stock
- The percentage of products to sell at full price
- The full price
- The discounted price
- The number of products at full price (the C7 cell below, formula isB3*C3)
- The number of products at a discounted price (the C8 cell below, formula isB3*(1-C3))
- Total revenue based on these prices and sale numbers (formula in the table below isC7*D7+C8*D8)
You’re the one defining the first four figures on this list, and Excel formulas are in charge for the remaining three.
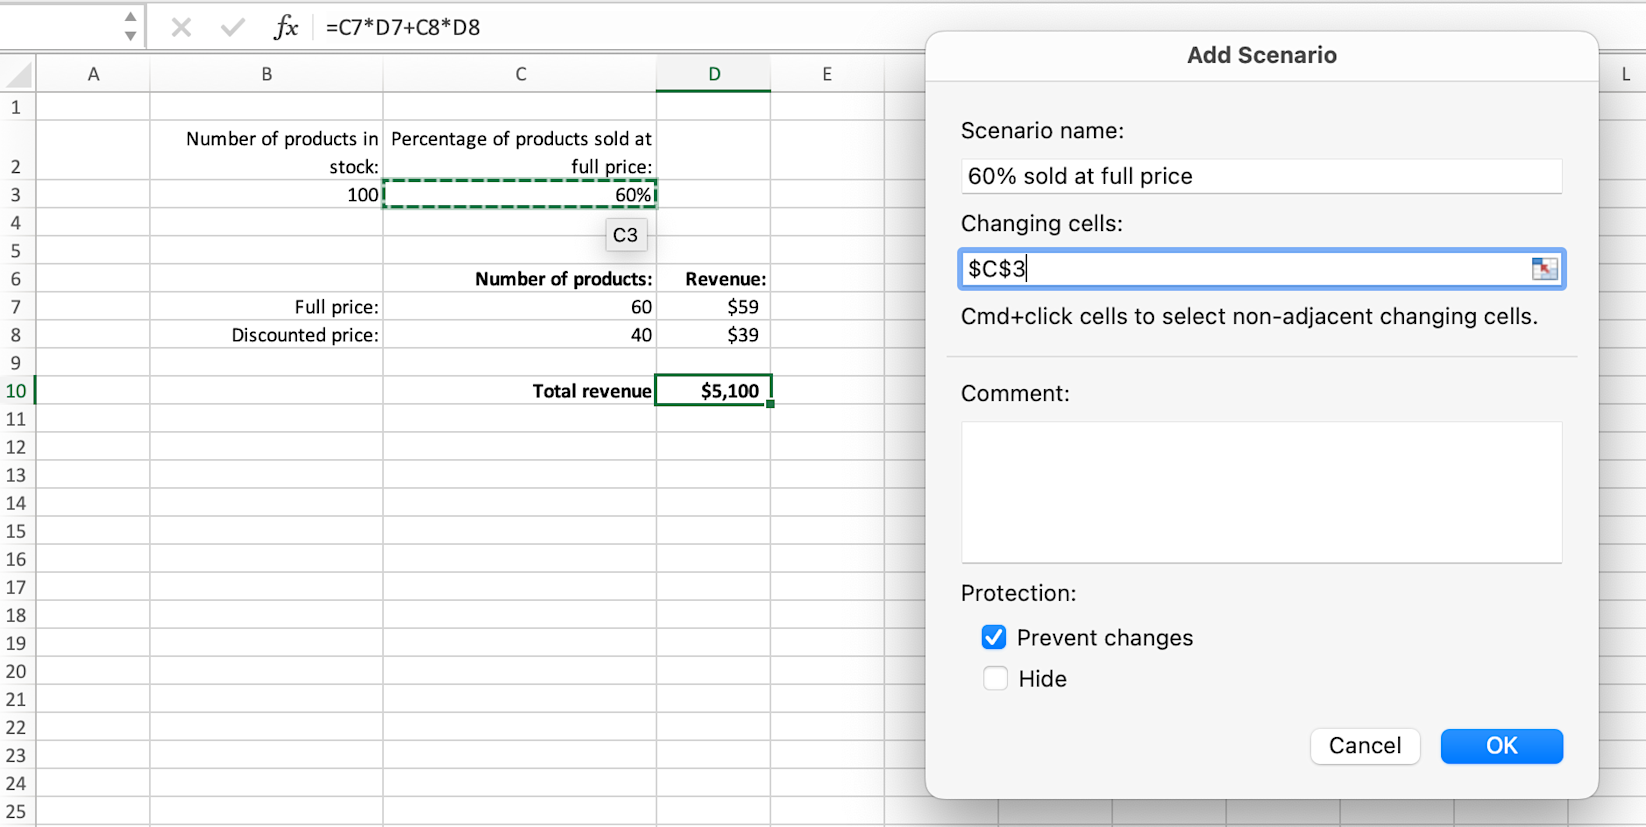
With that in place, click the Data tab, then What-If Analysis, and finally Scenario Manager.
In this dialog box, click Add or the plus sign to add a scenario. You can name the first scenario “60% sold at full price,” then click on the “Changing cells” field and select your percentage cell in the table (in this case, C3). Click OK.
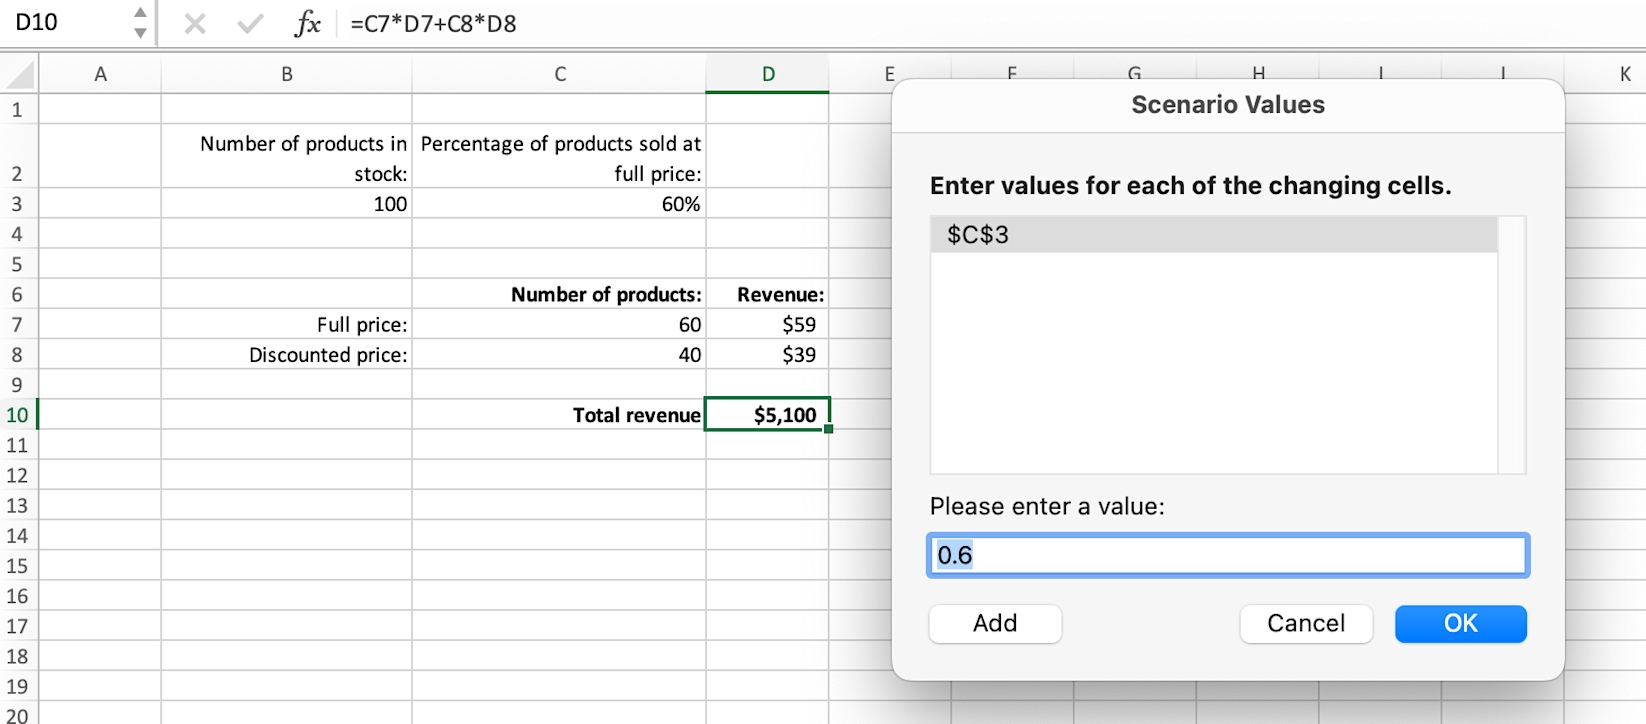
On the next screen, enter 0.6 as the value for this changing cell, because it includes 60% of products sold at full price. Click OK.
Continue adding as many scenarios as you wish—for example, you might include one with 70% of products sold at full price, 80%, 90%, and the entire inventory.
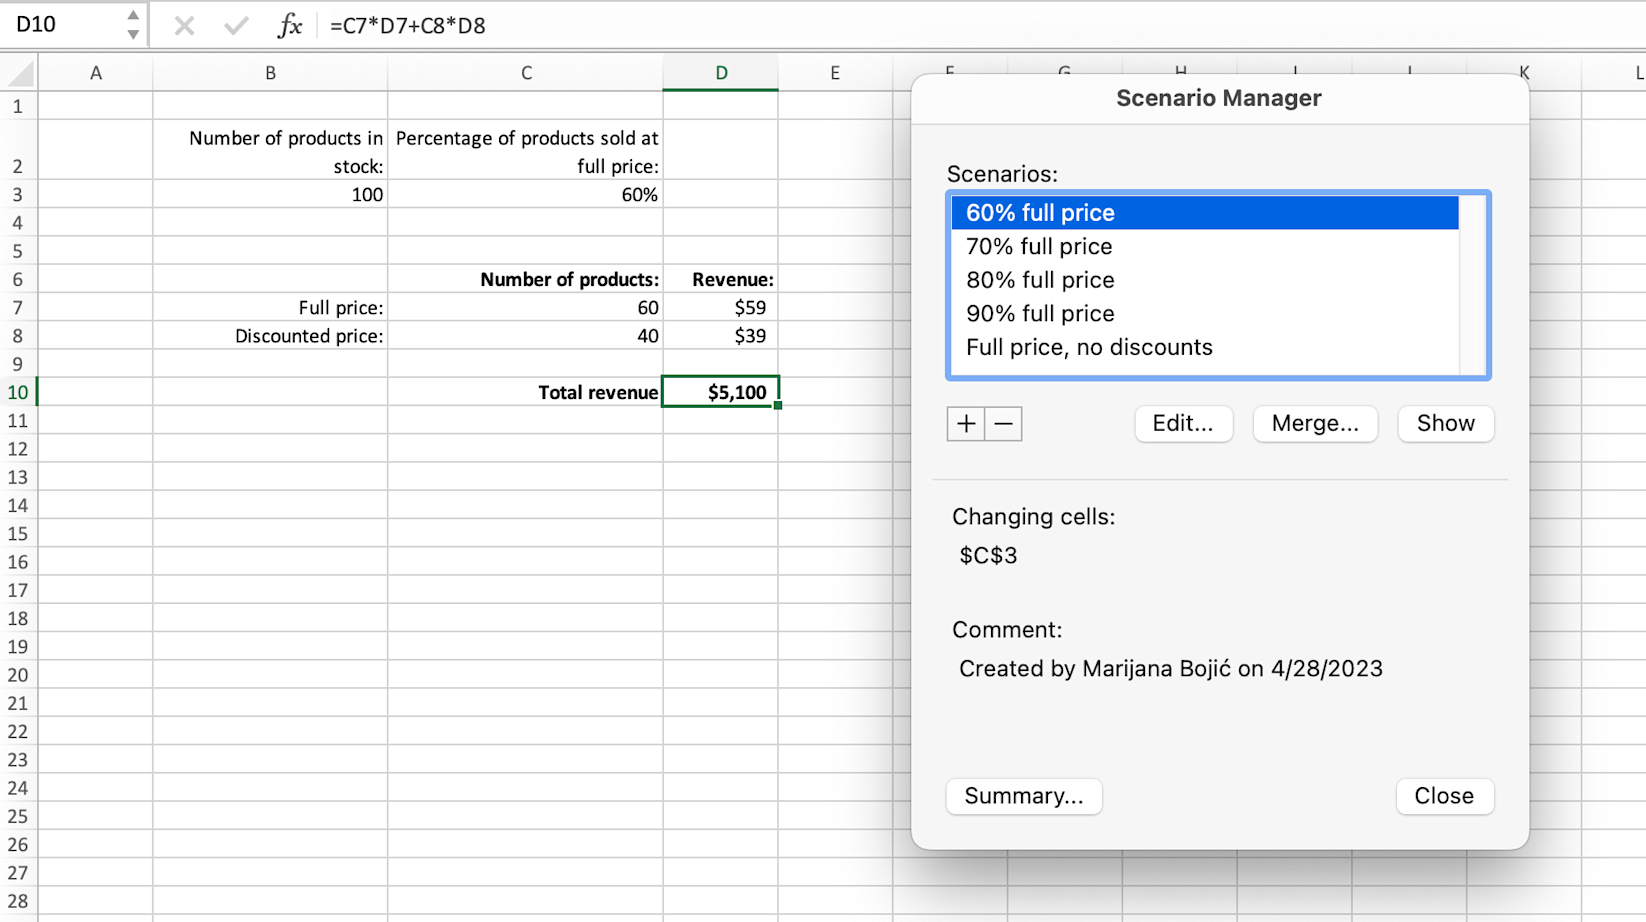
From here, clicking on a scenario and then clicking Show will change the numbers in your table to reflect that variable.
The most valuable aspect of the Scenario Manager feature is Scenario Summary, which compares these different scenarios side by side.
Click Summary and make sure that the result cell selected is the one that contains your revenue from the table, like so:
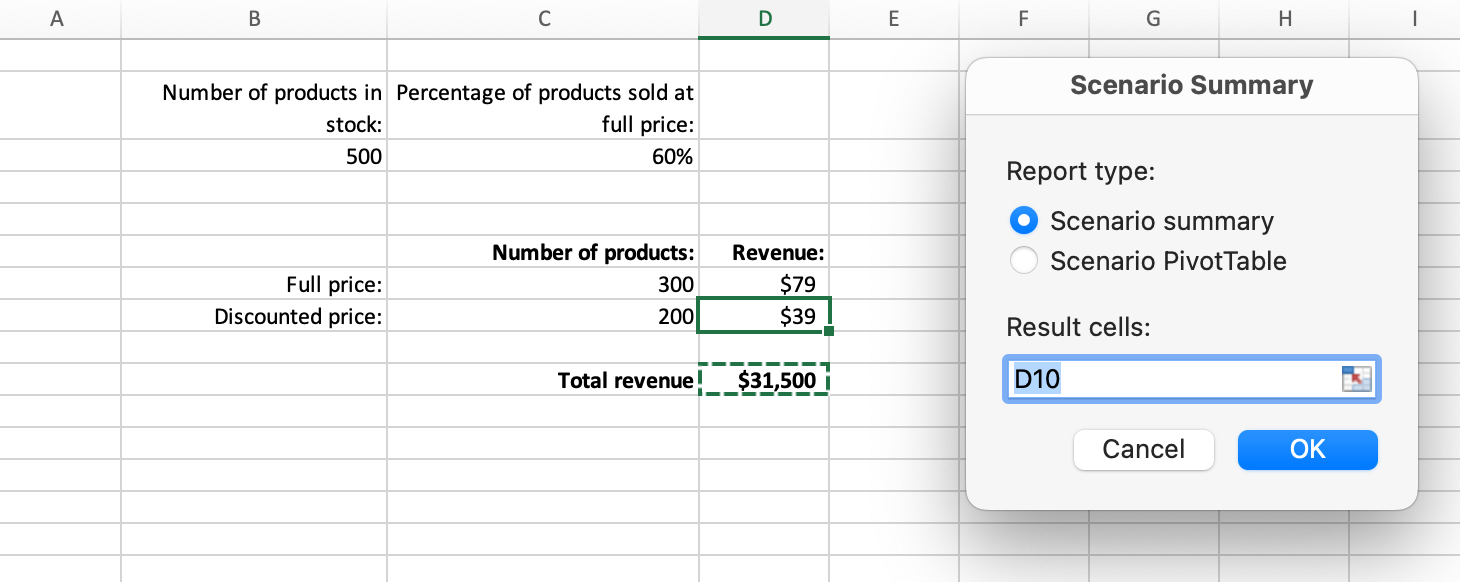
After clicking OK, Excel will generate a new sheet with this summary:
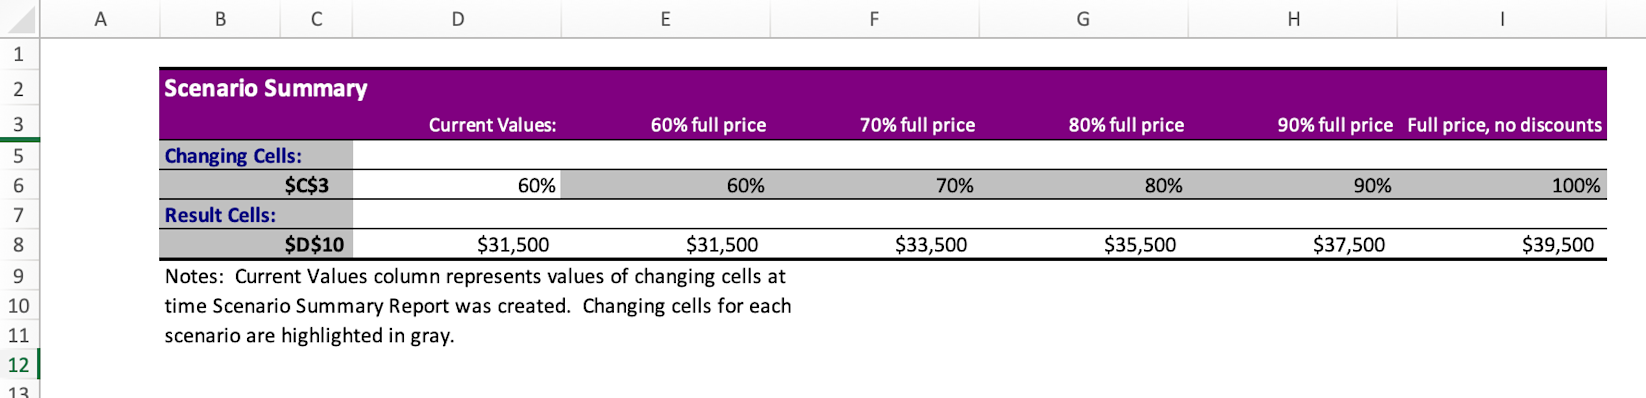
改变任何数字在你的表在你通用电气nerated a summary won’t affect the summary. The main benefit is that you can tweak each input value in your table, like the size of your inventory, the full and discounted prices you’re selling them at, and the portion you can sell at full price versus a discount and generate multiple scenario summaries.
This way, you can see many different but tangible scenario outcomes, compare them side by side, and visualize how they impact your business as a whole.
Goal Seek
如果你已经有一个分ed outcome and want to find out the parameters you need to hit in order to get there, the Goal Seek feature is for you.
年代ay, for example, you have a revenue goal and you want to learn thekey performance indicators(kpi),比如在线商店游客的数量欧宝体育官网入口首页r a conversion rate, that you need to hit to meet that goal.
Goal Seek makes it possible to reverse engineer your desired outcome.
Here’s how to set up this example in Excel with Goal Seek, step by step:
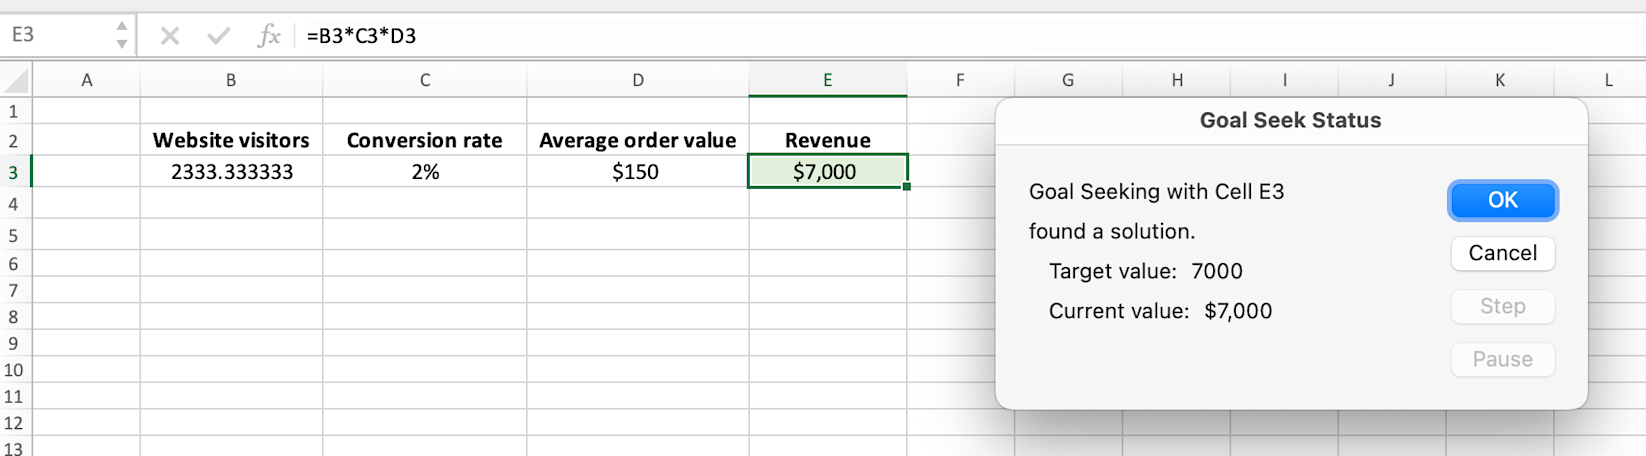
First, set up your key metrics in a table. For example, the number of website visitors, the average conversion rate,average order value(AOV), and the revenue that is the result of those input values (in the table below, the formula to calculate it isB3*C3*D3):
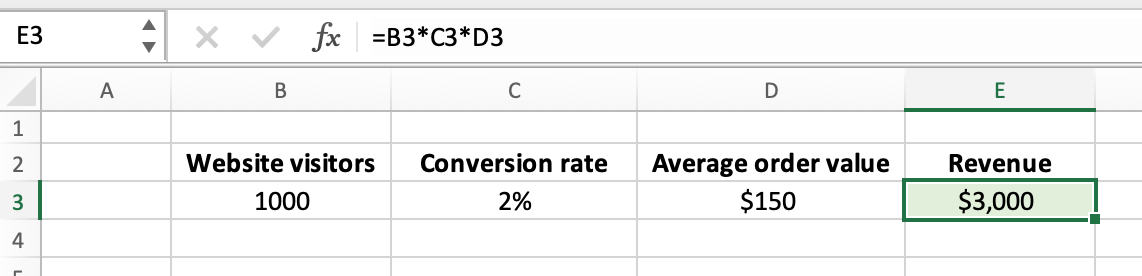
Use the input values that closely match your average website visitors, conversion rate, and AOV because that will help you get the most accurate number.
In the Data tab, click What-If Analysis, then Goal Seek. Select your revenue for the “Set cell” field and enter your goal revenue in the “To value” field. In the “By changing cell” field, click on the KPI you’re looking to change to reach that revenue goal. This example explores changing website visitors in order to hit a $7,000 revenue:
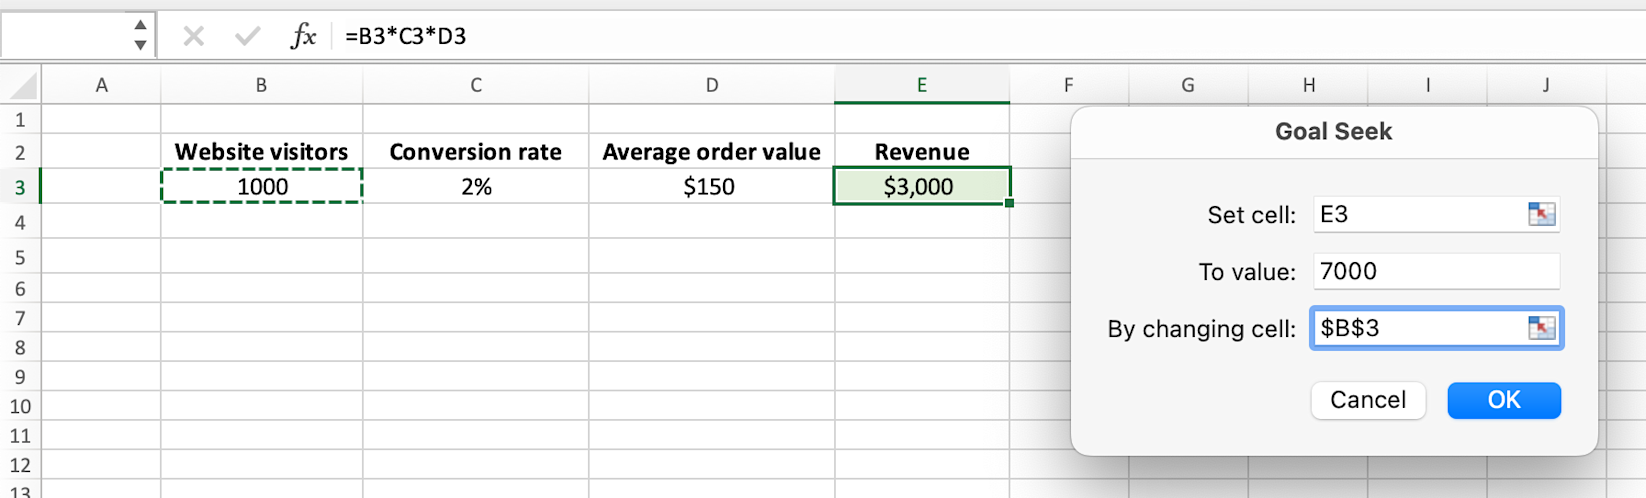
The what-if analysis returns a figure of 2,333 website visitors, while the conversion rate and AOV stay the same.
You can keep running the Goal Seek analysis for other KPIs—in this case the conversion rate and AOV—to inform your marketing campaigns and strategic decisions you need to make to hit a goal revenue.
Data Table
The Data Table function enables you to plot all the potential outcomes in a table if you’re only changing one or two variables.
Mapping out your profitability is a great example of this. Once you know your fixed costs to run your store and the profit you make for each product you sell, you can explore how your profit varies based on the number of products you sell, as well as how that changes if your profit per product changes.
Here’s how to use Data Tables for this use case in Excel, step by step:
First, set up your basic data and formula. In this case, the two variables to explore are the number of products sold and profit per product sold; the fixed costs to run your store is a part of the formula, too.
The formula is then:profit per month = (number of products sold * profit per product sold) - fixed costs, which is(C4*C3)-C2if your setup looks like this:
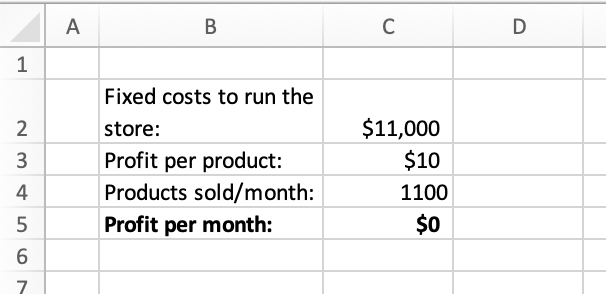
In this example, 1,100 products sold at a $10 profit per product is the break-even point once the fixed costs to run the store are deducted.
To use the Data Table feature to see how changing profit per product or the number of products sold influences monthly profit, start by duplicating your profit per month figure below (in this setup, it’s=C5):
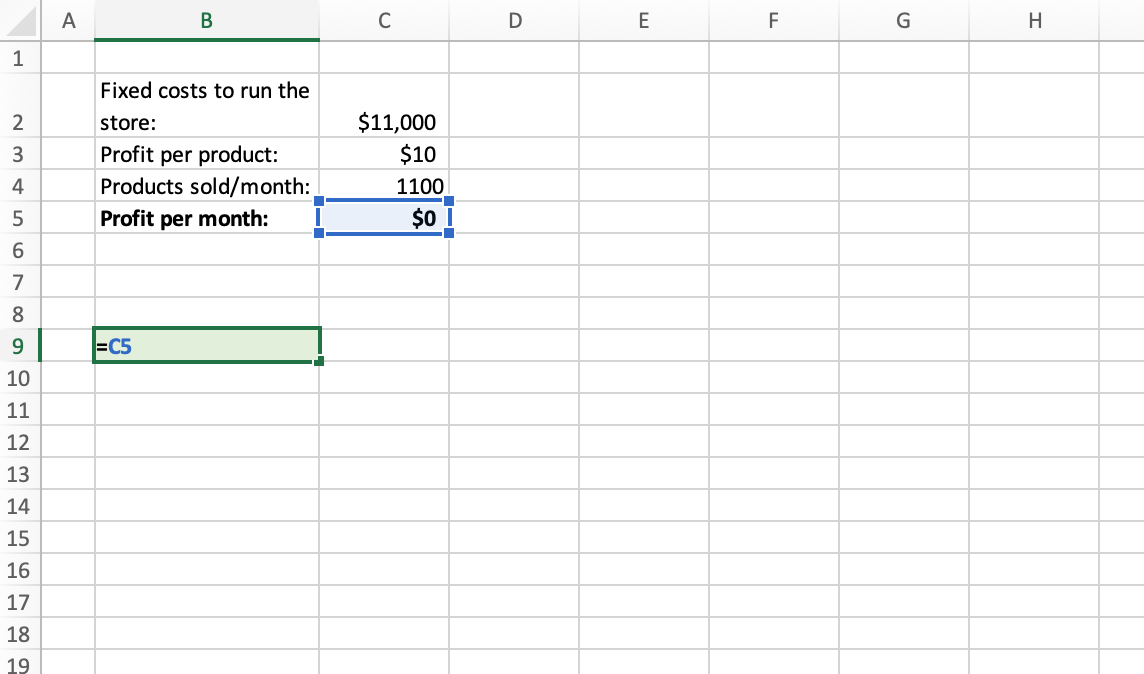
This will be the foundation for the Data Table feature.
Next, in the column below the profit per month figure, list different options for the number of products sold per month. For example, start from 500 and increase that number by 100 in each new row.
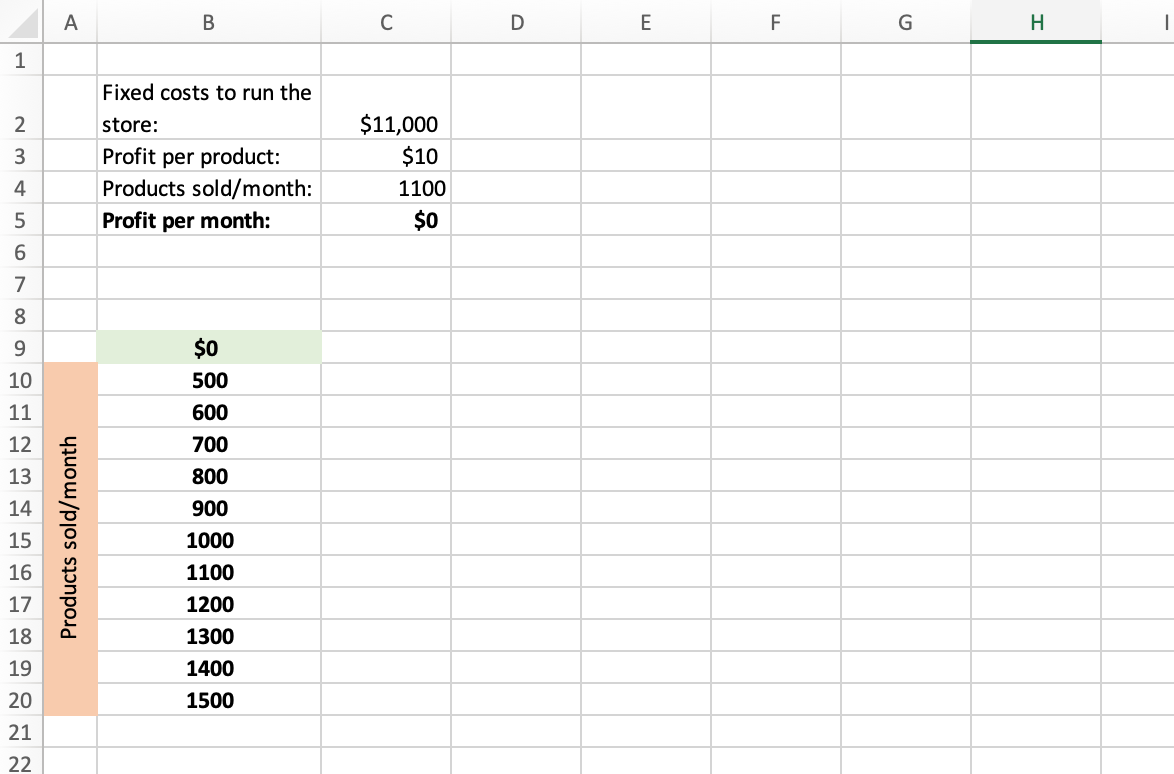
Repeat the same process on the horizontal axis for profit per product. For example, start at $10 and increase by $5 for each next cell.
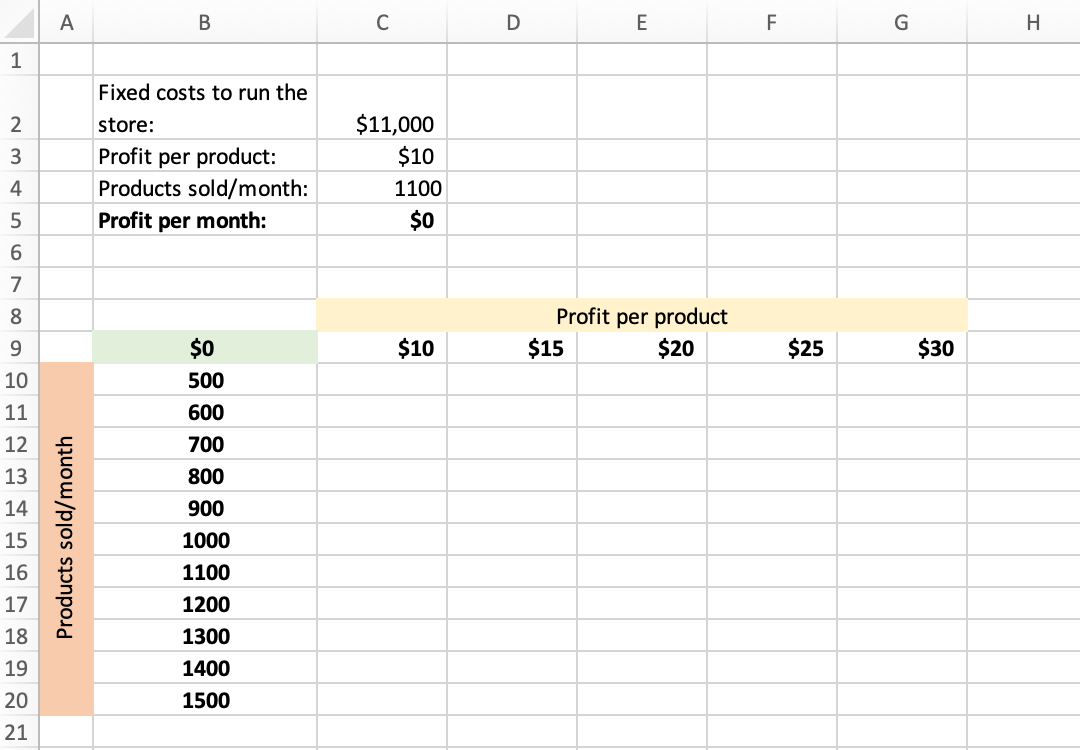
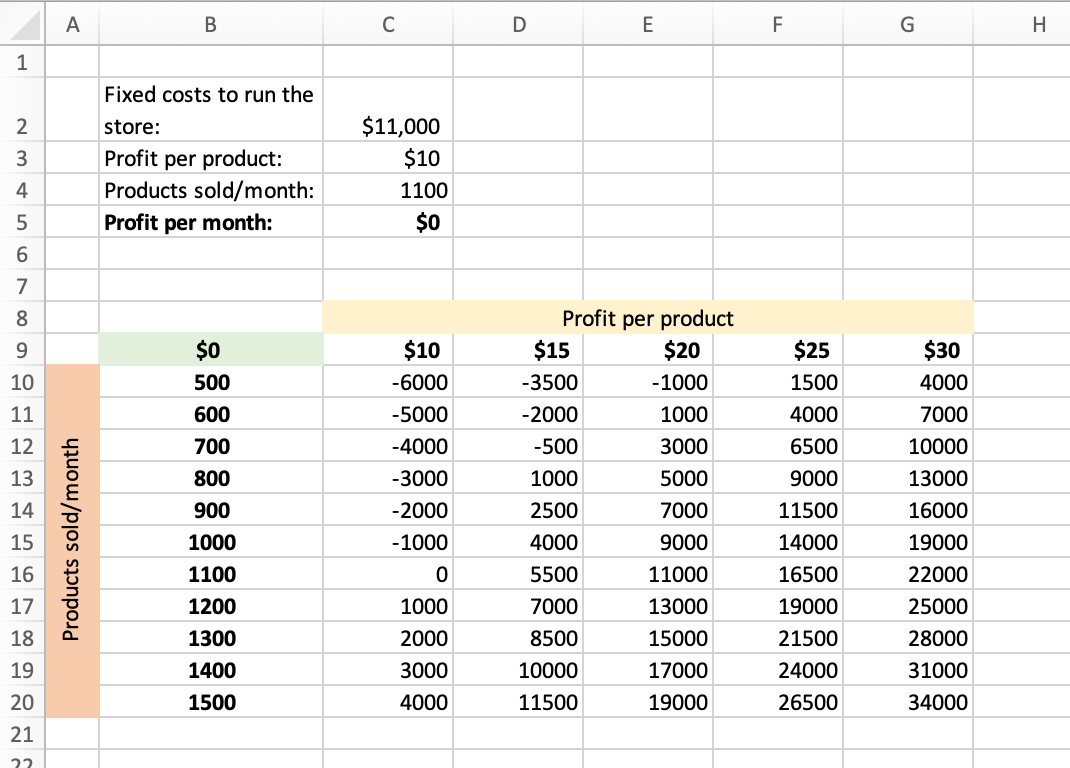
Finally, select your blank table starting from the “Profit per month” cell. Then click the Data tab, What-If Analysis, and Data Table. For row input cell, click on the profit per product figure above (C3), and for column input cell on ”Product sold/month” figure (C4), then click OK.
That’s it—your Data Table is ready. You can now analyze how the number of products you sell and the profit you make for each of them affects your profitability and either pushes you into the red or makes your store profitable.
And remember: changing the fixed costs figure also impacts these numbers, so if that number is something you can change in the future, your what-if analysis will show you how it fits into the bigger picture.
Make the right decisions with a what-if analysis
A what-if analysis isn’t the perfect mechanism that solves every problem you run into and makes every decision easy. No tool or tactic is. But it can make big necessary calls less stressful because it lets you visualize plenty of potential scenarios.
Broadening your product range, scaling up, expanding into a new market—whatever goals you’ve set for your store, data from a what-if analysis will help you get there.
What-if analysis FAQ
What is a what-if analysis in business?
A what-if analysis lets you play out and compare different scenarios in your business in order to make the best decision possible. For example, you can use what-if analysis to see how changing your profit per product affects your break-even point and your profitability, or how driving more visitors to your website affects your revenue.
How do you create a what-if analysis in Excel?
There are three ways you can run a what-if analysis in Excel: Scenario Manager (multiple variables), Goal Seek (reverse engineer your goal), and Data Table (one or two variables).
You can access all three what-if analysis options under the Data tab in Excel.
What-if analysis is also known as?
What-if analysis is also known as scenario analysis or scenario planning. That’s because it lets you compare different scenarios in your business to help you make the best decision possible.
What is a what-if scenario?
A what-if scenario is a calculation of a future outcome based on changing variables. For example, when you tweak the discount percentage of a product, your revenue at the end of the sale period changes—calculating this in advance makes this a what-if scenario.
What are the benefits of what-if analysis?
A what-if analysis aids with decision making as it reduces the need to guess the outcomes, it makes communication between you and your team members and stakeholders clearer, and it helps you move quickly because it removes the need to manually calculate outcomes for different paths you can take.
Read More
- How to Avoid the Hidden Cost of Black Friday, Cyber Monday Sales and Increase Customer Lifetime Value through Personalized Email
- B2B Ecommerce Features for Acquiring, Selling & Retaining Customers
- Why Are You Still Paying Over $1 Million for an Ecommerce Site? The Answer May Shock You
- 4 Strategies to Future-Proof Your Brand
- What Conversion Experts Wished You Knew About Optimization
- International Ecommerce Issues: How to Diagnose Global Barriers with Analytics
- Ecommerce Chatbots: 22 Ways to Increase Sales, Conversions & Retention
- Hypefest 2018: O2O Examples from the Forefront of Marketing & Retail
- Holiday Automation with Flow: 10 Ways to Make Black Friday Easier, More Profitable