

Google Analytics is like a window into your website, revealing insights that can improve your marketing and conversion rates. When you first log in to Analytics, it can feel like entering a giant library full of foreign-language books, especially in Google’s new version of the software, GA4.
Fortunately, once you understand the basic framework that underpins Google Analytics, it is much easier to use. This structure revolves around two fundamental data categories: metrics and dimensions. While metrics—quantifiable values that fluctuate—are generally straightforward, Google Analytics’ notion of dimensions demands a touch more insight.
Here’s what you need to know about dimensions in Google Analytics.
✂️ Shortcuts
What are dimensions in Google Analytics?
In Google Analytics, dimensions are attributes that help you categorize your website visitors, sessions, and interactions. They help you analyze data by dividing it into distinct categories.
Dimensions work alongside metrics, which are numeric representations of user behavior like pageviews, bounce rates, and session durations. Dimensions add context to metrics, revealing insights into your site’s performance and user actions.
Combining dimensions and metrics lets you craft precise reports and scrutinize audience segments, revealing patterns, opportunities, and areas to refine your digital strategy. In Google Analytics, dimensions have green labels, whereas metrics have blue labels.
How do Google Analytics dimensions work?
Most Google Analytics reports are organized as tables or charts with the X metric segmented by the Y dimension. For example:
- “Users” (metric) by “Age” (dimension)
- “Transactions” (metric) by “Country” (dimension)
- “Sessions” (metric) by “Source” (dimension)
- “Add to carts” (metric) by “Product Name” (dimension)
Some dimensions have prescribed options. For example, Google Analytics has apreset list of countriesit refers to for its “country” dimension. Other dimensions, such as “product,” can be defined by whatever website data you provide. If you’re on Shopify, thenative Google Analytics 4 (GA4) integrationautomatically populates Google Analytics with your store’s product data.
There are over170 standard dimensionsin GA4. Most businesses don’t need all of them. For example, there’s a set of dimensionsrelated to ecommerce(including “ecommerce purchase ID,” which allows you to track individual purchase transactions, and “product SKU,” which can help you understand which products are selling well and which ones may need more promotion) and another setrelated to gaming(including “level name,” to track user progress within different levels, and “game version,” which allows you to monitor user activity in different versions or updates). It’s unlikely a website needs both.
Advanced users can also create up to 25 Google Analytics custom dimensions to capture data that is not automatically tracked, such as a dimension indicating whether a purchase is one-time or recurring. However, according to Google’s privacy policy, dimensions cannot include personally identifiable information (PII), like names, emails, or phone numbers.
Types of dimensions in Google Analytics
Google Analytics classifies dimensionsbased on the corresponding metric types, resulting in four distinct categories of dimensions. (These categories align with the four types of metrics.) The metric type to which a dimension is linked determines its scope—essentially, the range of metrics to which these dimensions are applicable.
Here are the four dimensions types and a few common examples for each:
1. User scope
User-scoped维度属性的刊物特色dual user, separate from the actions the user takes on the website. User-scoped dimensions generally remain consistent throughout their entire session on a website.
Examples of standard user-scoped dimensions include:
- First session date.The date on which the user first visited the website.
- Age.The user’s age by bracket; either “18-24,” “25-34,” “35-44,” “45-54,” “55-64,” or “65+.”
- Last active date.The date on which the user most recently engaged with the website.
2. Session scope
A Session is an individual visit to a website by a user, including all of their activity during the visit. If a user visits a website twice in one week, that week has one “User” and two “Sessions.” Session-scoped dimensions are the properties related to the visit.
Examples of session-scoped dimensions include:
- Session source.The website that referred the visitor to your website. This can be expressed as a website (e.g., “facebook.com”) or a source type (e.g., “email”).
- Session duration.The time a user spends visiting the website before leaving, expressed in minutes and seconds.
- Device category.The device type on which the user visited the site (e.g., “Desktop,” “Tablet,” or “Mobile.”)
3. Item (product) scope
Item-scoped dimensions are properties attached to an individual product or service for sale on a website. In the previous version of Google Analytics (Universal Analytics), these were referred to as product-scoped dimensions, referring to ecommerce products. In GA4, that definition was widened to “items” to apply to both products and services. This set of dimensions is integral for conducting e-commerce analysis.
Examples of standard item-scoped dimensions include:
- Item name.The name of the product or service.
- Currency.The currency the product or service is sold in.
- Item brand.The brand of the product or service (relevant for stores that sell multiple brands).
4. Event scope
Event-scoped dimensions are for properties related to anything other than a user, session, or item. Examples of events are pageviews, form submissions, and scrolls.
Examples of standard event-scoped dimensions include:
- Page title.The page’s name from a pageview.
- Percent scrolled.How far down a page a user scrolls. This is tied to an automatic event called “Scroll” that triggers repeatedly as a user moves down a page. For example, 90% scrolled means the user has scrolled through 90% of the page displayed on their device.
- Hour.The hour of the day in which any event occurred. For example, an event at 9 a.m. has a value of 9.
How to use dimensions in Google Analytics
Once you understand the fundamentals of dimensions, you can go beyond a standard Google Analytics report to create new insights for your business. Here’s how:
1. Add secondary dimensions to reports
GA4 comes with several pre-made reports for website managers. Once you understand dimensions, you can customize them to fit your context.
Most reports start with a single primary dimension and multiple metrics. For example, below is a portion of one of GA4’s most popular reports, the Traffic acquisition report, which organizes the “Users,” “Sessions,” and “Conversions” metrics (not pictured) by the “Session” dimension default channel group.
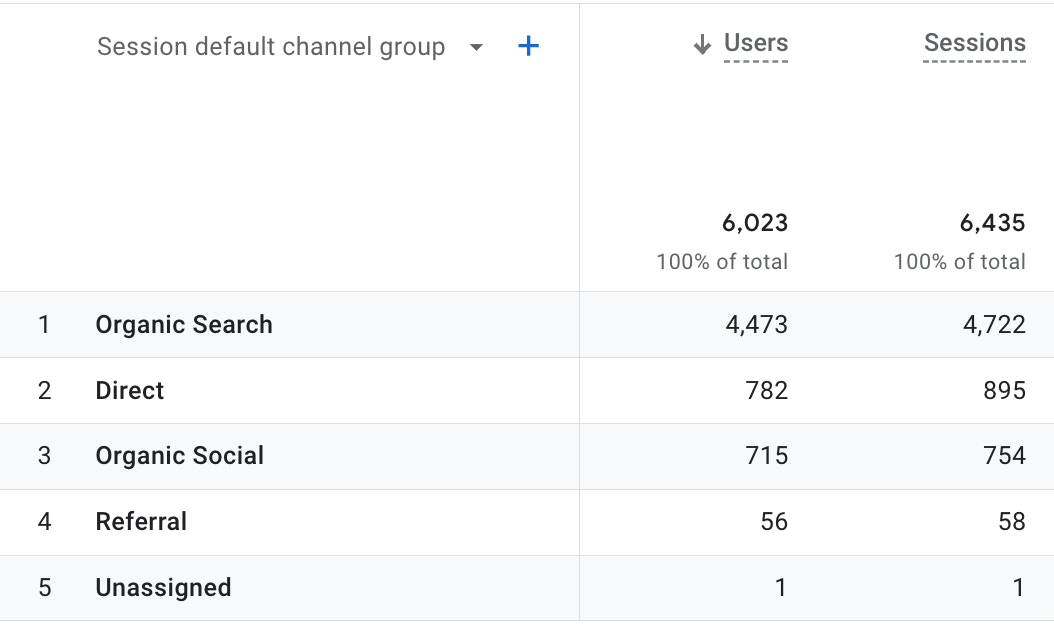
This example site, which sells flooring products, receives significant traffic from organic search results. As a marketer, you may want to understand which webpage users are landing on when coming from these sources. You can learn this by clicking the blue “+” icon (visible in the screenshot above) and selecting “Landing page” as a secondary dimension. This adds a second layer of segmentation to the report, showing the most common combinations of “Session default channel group” and “Landing page + query string” for a “User“ or “Session.”
This more customized report shows what products and pages have been the most successful in bringing in users, which in turn may help refine the company's SEO, marketing, and product strategies.

2. Create custom reports
GA4 has a robust Explorations tool for creating your reports, which can help you create various metric and dimension combinations, plus multiple options to visualize them:

GA4用户可以使用模板画廊选择preset reports; experienced users can build templates from scratch by selecting “Blank” and choosing their combinations of metrics, dimensions, and visualizations from scratch. Examples of custom reports useful for ecommerce stores include:
- Add items to cart (metric) by Item name (dimension)
- Item revenue (metric) by Currency (dimension)
- Purchases (metric) by Item brand (dimension)
3. Create custom dimensions
You can go beyond GA4’s existing setup by adding custom data specific to your business. Creating custom dimensions is simple: go to the Admin section of your Google Analytics account and find “Custom Dimensions” next to “Custom Metrics” under “Custom Definitions.” Ensure you define the correct type of dimension.
Examples of custom dimensions that can be helpful to ecommerce companies include:
Collection filter type
This can help you track clicks to your store’s shopping filters and use a custom dimension to define the filter type, such as price or size. This data can inform future collection page UX decisions by showing what filters matter most to your shoppers. For example, if most users employ filters for color, you could try improving their shopping experience by offering color options next to your product images.
Item/Product size
If you sell apparel and your product comes in different sizes, adding a custom dimension value for size can help you run reports and anticipate future stockouts or reorders.
Form submission type
Many stores have a multipurpose contact form with options to reach out about product support, wholesale orders, or other specific use cases. By tracking form submissions and adding a custom dimension based on the type of submissions, you can gain more insight into whether your form submissions are marketing-, sales-, or support-based.
What is a dimension in Google Analytics FAQ
How are dimensions different from metrics in Google Analytics?
Metrics are numbers that can fluctuate, such as pageviews. Dimensions are the properties related to these metrics used to segment and analyze them. For example, you can create a report breaking down the “Pageviews” metric by the “Page title” dimension.
What are default dimensions in Google Analytics?
Google Analytics comes with over 170 dimensions. These are properties it tracks by default and anticipates are most helpful to marketers. Examples include “Page title,” “Session source,” and “Age.”
What are custom dimensions in Google Analytics?
Google Analytics provides the ability to track properties outside of its default dimensions. This is an opportunity to get more specific context with your data. Examples of custom dimensions include “User type,” “Purchase type,” and “Page category.”
Can dimensions be combined in Google Analytics?
No, dimensions cannot be combined in Google Analytics. Every dimension has its own set of data that is incompatible with other dimensions. secondary dimensions offer a powerful way to sub-segment your data by adding a second dimension to your reports, allowing you to gain deeper insights by examining how two dimensions interact with and impact your metrics.